
🚀 How much does a billion-dollar game spend on marketing? Monopoly Go won’t tell us, but we did some sleuthing to come up with some estimates, thanks to data from our friends at Sensor Tower.
Join the conversation as we unravel how the billion-dollar sausage is made. 🕹️📊

ABOUT SENSOR TOWER: Website
ABOUT ROCKETSHIP HQ: Website | LinkedIn | Twitter | YouTube
KEY HIGHLIGHTS
🛳️ Flat revenue trend over the last 4 months, signaling a potential plateau in growth.
🛩️ iOS and Android downloads show a steady decline, especially in the U.S. suggesting a shift in UA strategies.
🛎️ The diverse advertising strategy includes prominent shares of voice on platforms like AppLovin, BidMachine, and surprising placements on Snapchat.
⌚ Analysis hints at a substantial UA budget, potentially exceeding $60 million per month, although recent trends suggest a conservative shift post-August.
Today we’re going to deconstruct one of the biggest launches of recent times: Monopoly Go, a game that’s hit a billion+ in lifetime revenue within about seven months of its launch as of mid-November.
This is going to be a review of where the game is now and what you can expect from it going forward after such a huge launch. This data is thanks to our friends at Sensor Tower who have provided access to their insights. They have very comprehensive insights on their platform. Check them out at SensorTower.com
So let’s go check this out. These are their revenue trends. You’ll notice the revenues are flat for the last four months. This is by geo so 79, 81, 75, 78, it hasn’t grown as massively since, July to August. July to August was a big jump, and it has not grown as much.
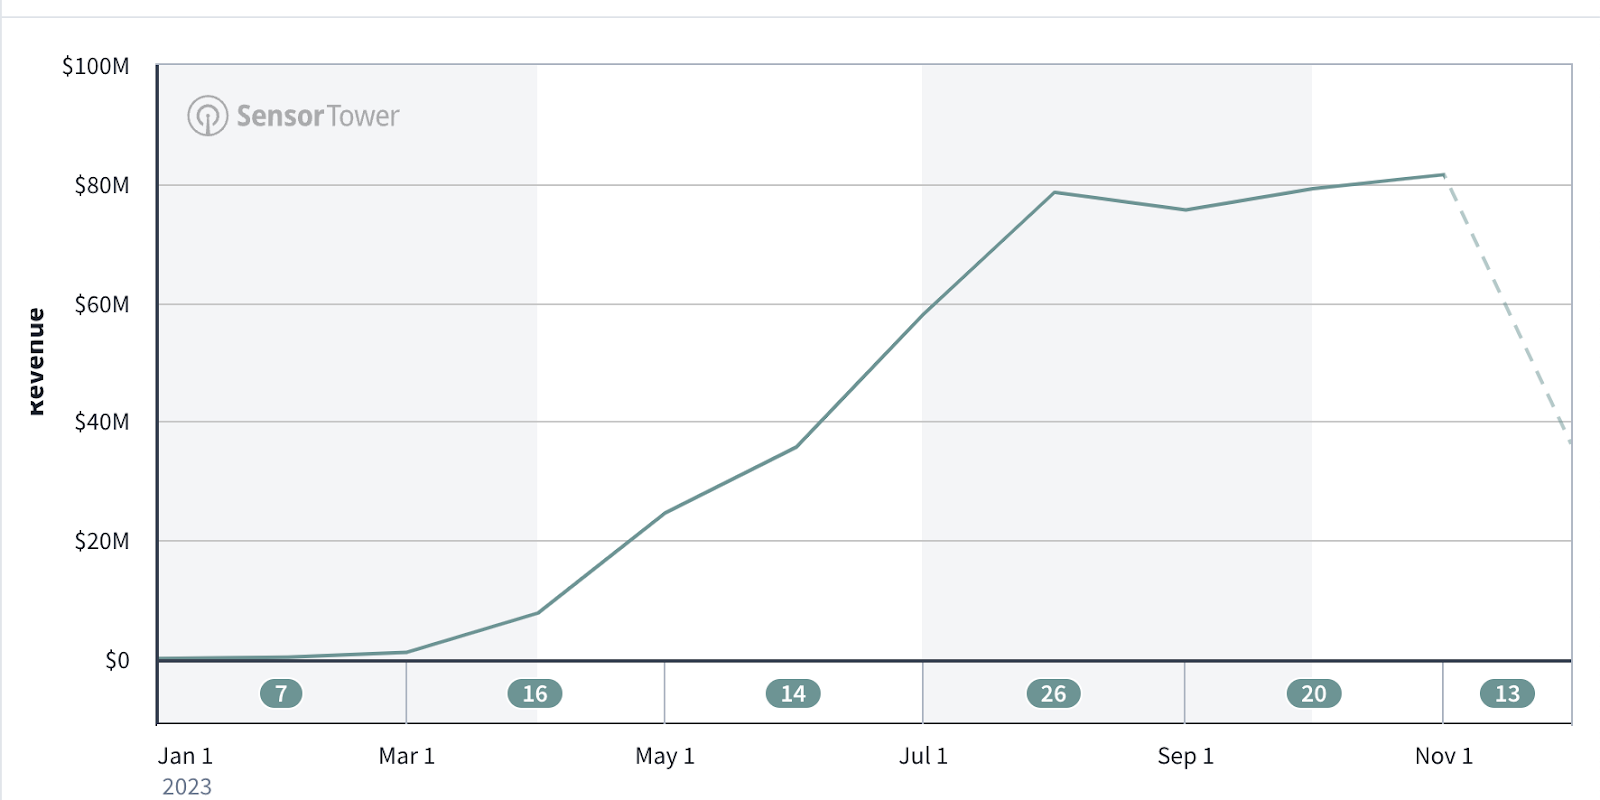
Now, I would also suggest taking these revenue numbers as directional, which is to say, these might not add up to a billion, but in my experience, these are very directionally accurate, which is to say, if you see the revenues being flat here, the real numbers are likely flat as well.
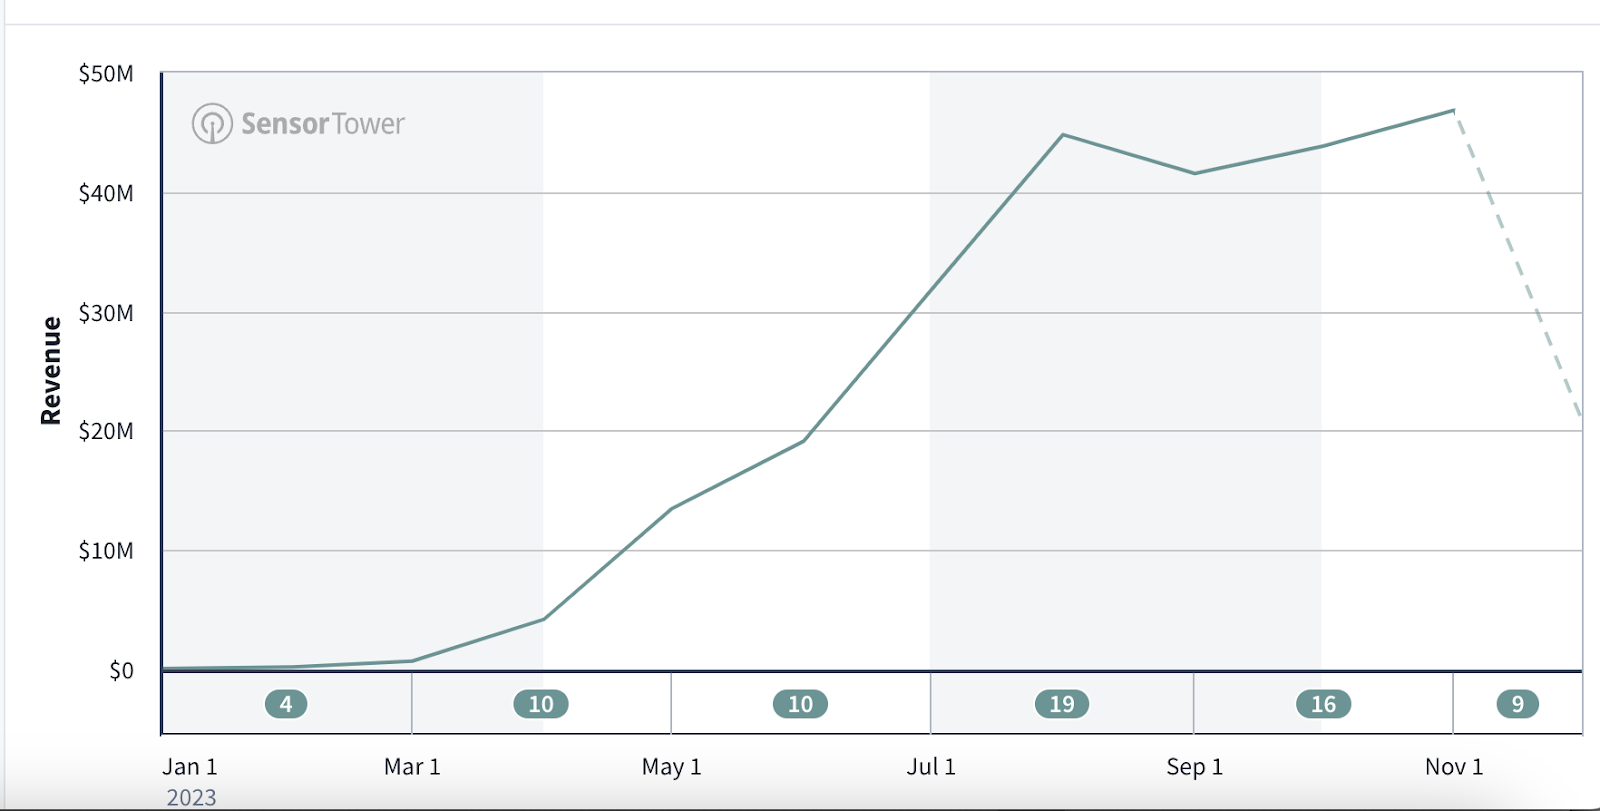
Let’s see how the game is doing on Android. There is a slight decline in overall revenue. The USA went from 21 to 20, overall went from 35 to 34. Partly this could be attributable to the increased competition due to Black Friday and the holiday season.
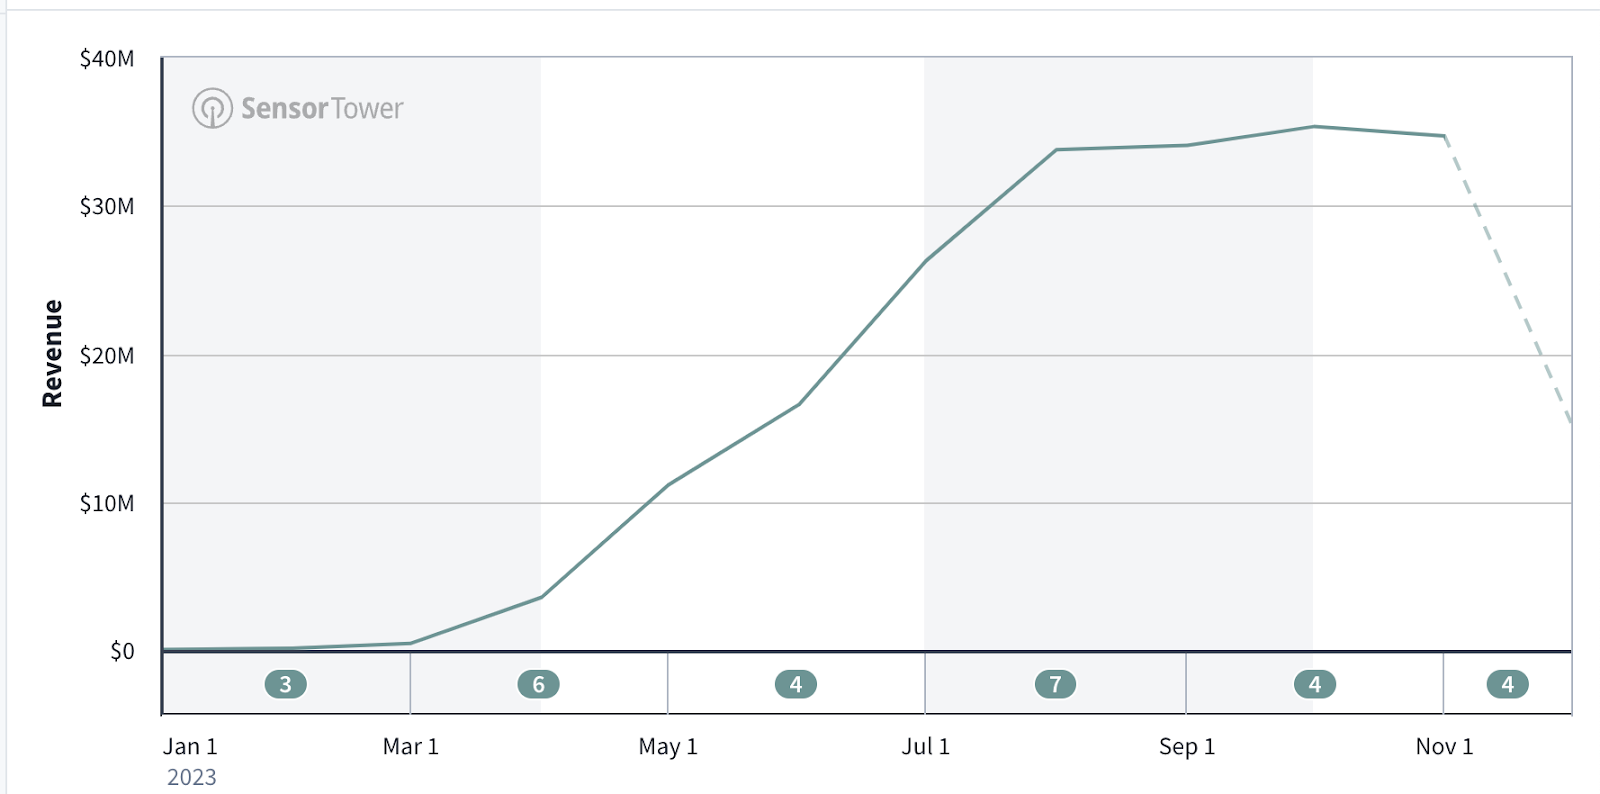
On iOS, there is a bit of an increase, but again, it’s not a huge increase and it’s pretty much at the same level as August. So the game is starting to plateau in terms of revenue.
Let’s see how it’s doing in terms of downloads. You can see the downloads are declining, so August was by far the biggest month on iOS with 7 million overall downloads and it’s close to 60%.
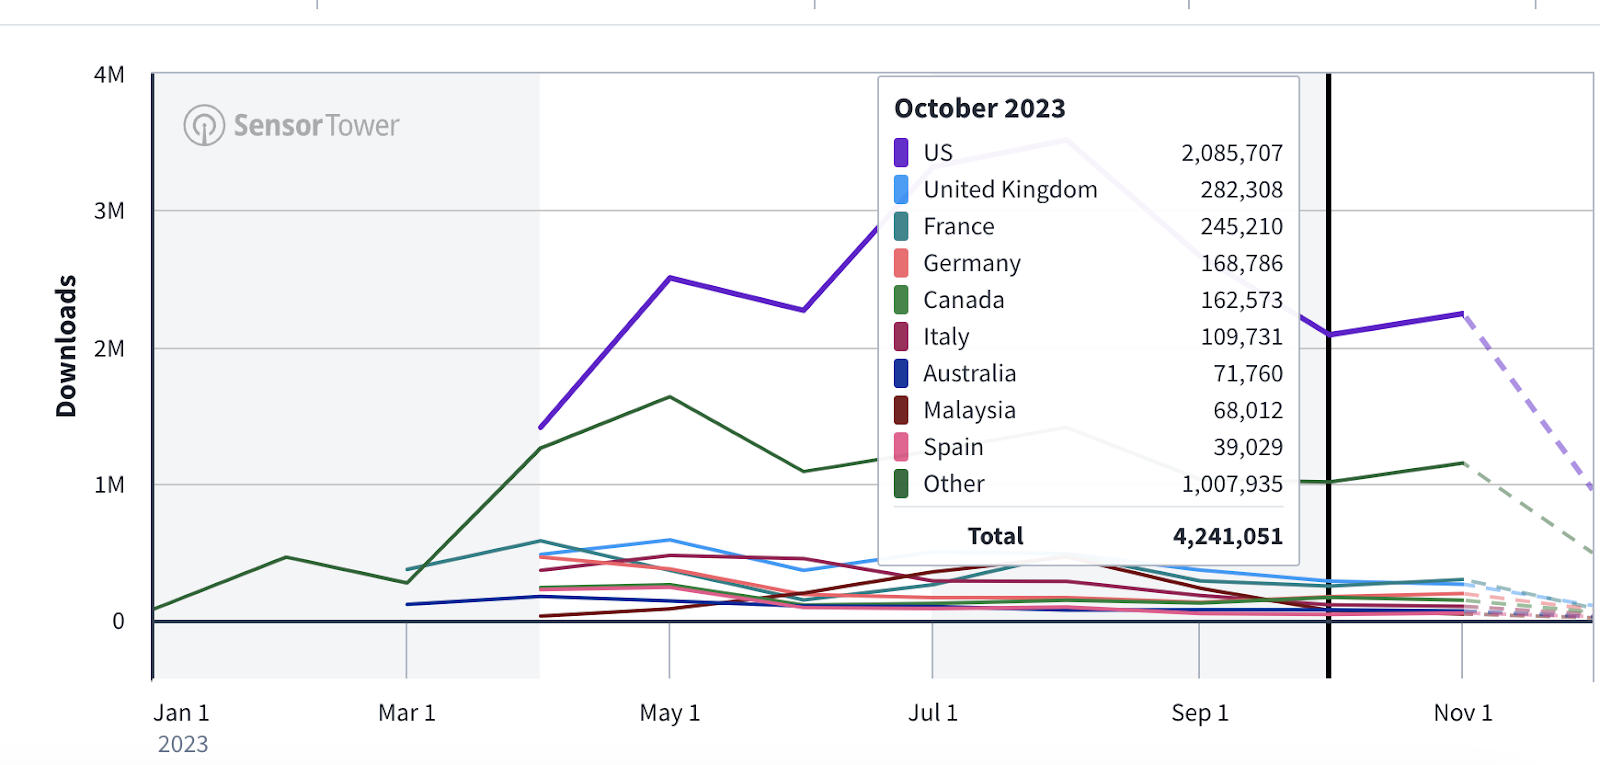
It’s 4.5M now with 2M on US iOS. f you look at Google Play, again this has been, declining since May, May, June, and July from 6M in May to 4.2M.
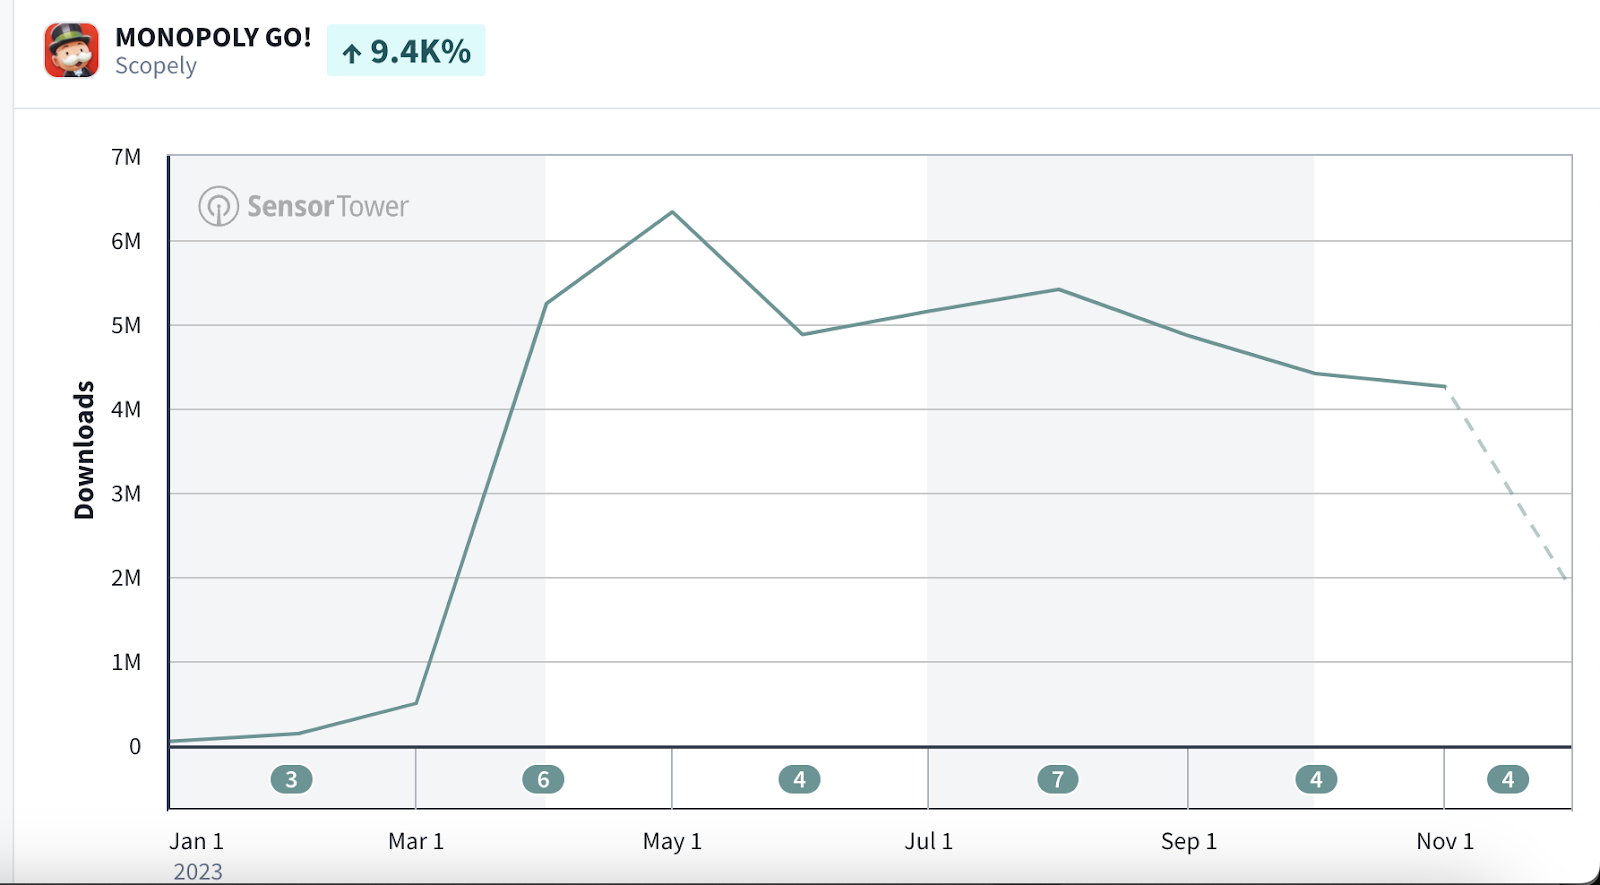
Now let’s look at download numbers. You can see here the overall downloads have been declining. So May was 6M, June was 4.9M, July 6M and 7M in August, and then it’s been declining since then.
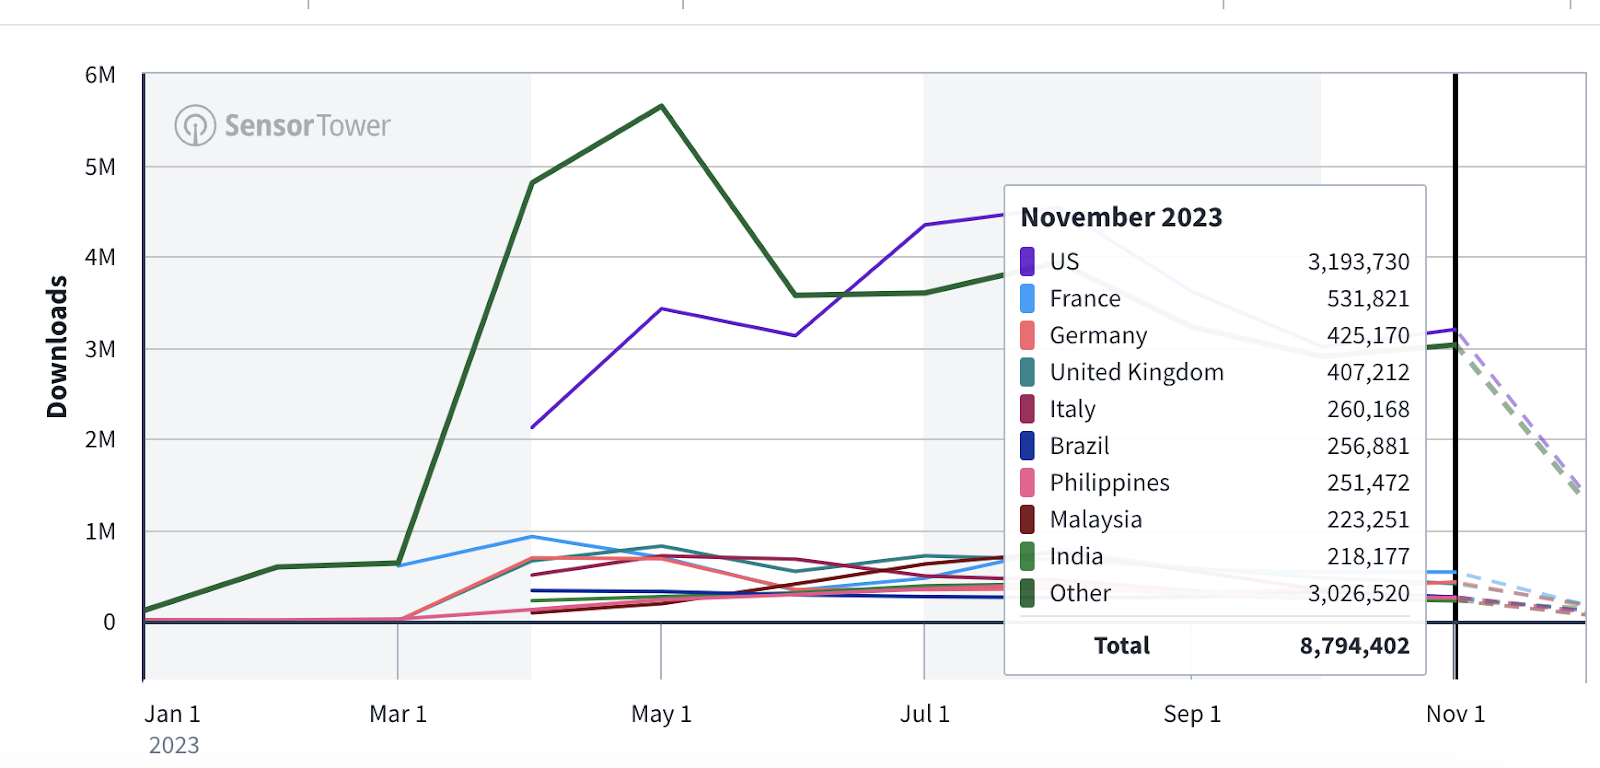
Bear in mind that the blue one is the US and the green one is other countries, which is the rest of the world. The US has had a decline in the last couple of months.
If you look at Android, the big green is the rest of the world, which is what you would expect on Android. Non-US countries can be fairly big. US, which is the blue line, is mostly flat. The rest of the world is declining. On Android, it was at 6M then 4.8, 5, 5.4, 4.8, 4.4 & 4.2.
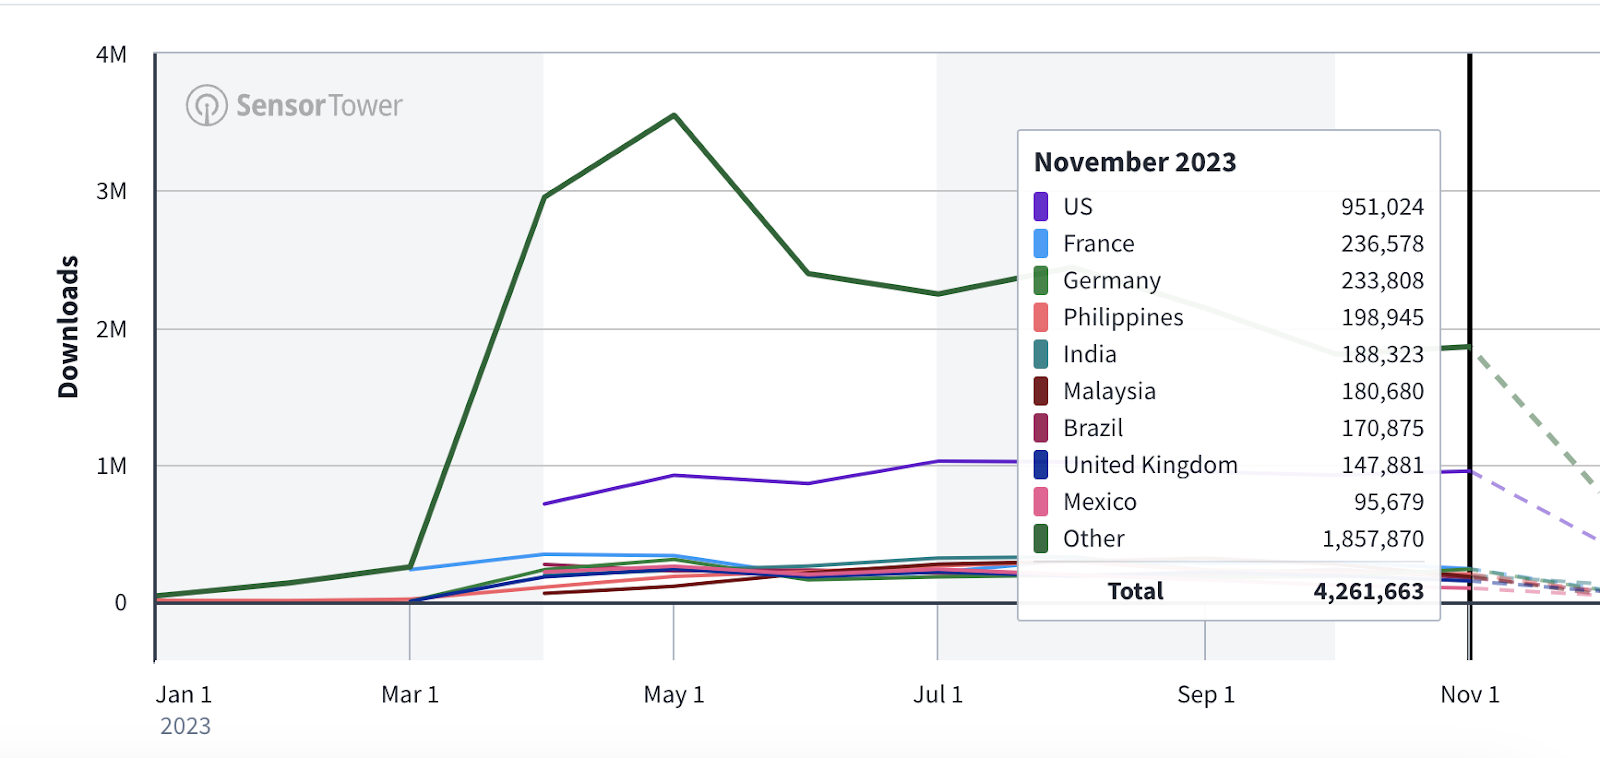
The overall download trend has been mostly flat, and you can see here’s a much more even distribution of downloads across countries. This is much more diversified, as you can see here.
And if you see unified, Android plus iOS, here are the trends you see.
Again, the US, as you saw, has been declining and the overall download numbers have been declining just as well right here from 12 million in August to about 8.7 in November.
What can we infer about how much they’re spending on UA?
First, let’s also take a look at what channels they’re on.
If you look at advertising and you see the network analysis, you will see they are fairly diversified across networks. Let’s look at what channels they’re on. You will see here they have a fairly diversified portfolio of channels. So obviously you can break this down by month and you can see the different channels they’re active on.
I will just look for the last 30 days now, so we can see what the most recent channel share is. This is AppLovin. There’s a fairly big share of voice on AppLovin.
This is BidMachine they have a fairly big share of voice.
Snapchat is surprising.
This is Verve, a 10% share of voice. Liftoff has 14, 21, and 17% share of voice by the top geos.
So this shows some interesting trends about where they’re spending.
YouTube, 3% share of voice, Mintegral, 4, 21, 11%.
This is InMobi, 5, 20, 13%.
It’s safe to infer that they are spending significantly on programmatic channels and ad networks.
You can also see outliers by geo. For instance, on France, it’s 50% of TikTok, which seems crazy when you think about it, so they have a diversified portfolio of channels and countries, which you can also see in the revenue and download mix. Even though the U.S. is basically 66% of their overall revenue.
Now, what does this tell us about what they might be spending? So if they hit a billion in mid-November, and the last four months are mostly flat, it would be safe to say their monthly revenue is roughly around 200 to 250 million in November. To be conservative you can take that as 200 million.
Now a lot of games that are focused on yield and profitability tend to spend no more than 30 to 35 percent of their monthly revenue on user acquisition. And if a game is aggressively focused on growth, that number may be higher. It could be 40 – 50% as well.
Now, when you look at the download trends, you see the downloads declining, especially in the U.S. which suggests that the UA budgets are dropping. They’re not scaling aggressively or at least as aggressively as they were a few months ago.
Part of it could be attributed to the holiday season and the increased competition in November and December. But part of it is just the reality of the marketplace. It’s that you run out of users to target if you’re spending 50, 60 million a month. The other thing you can also infer from these revenue trends, they were probably spending much more aggressively as a share of revenue the UA budget was much higher back in August, the revenue peaked and the UA downloads peaked, but the spend as a percentage of revenue dropped after August to September to October to November, which to me suggests that, they have been much more focused on profitability after August, potentially going to July and August, they were open to spending more aggressively, but since then it’s been much more conservative.
So if you would assume that their spend is about 30% of revenues, and assuming they did about 200M in, November, then that UA spend would be about 60 million per month or about 2 million per day, which is nothing to sneeze at, and it’s massive compared to the vast majority of other games out there.
But it’s also important to note that that number has probably declined. And if they have been much more conservative than spending 30% of their revenue on UA, that UA budget is probably lower than $60 million a month, which is probably closer to $30 to 40 million a month, given that the download trend is actually declining over the last three or four months.
It remains to be seen how they will grow in January when the competition is lower but. The game will also have matured much more significantly, and they are targeting a much more mature market where it is going to be harder to sustain spends of 30, 40, 50, and 60 million per month.
If you disagree, or if you have opinions to the contrary leave a comment. Let us know what you think. As always, thanks so much to our friends at Sensor Tower for providing this data, and for providing all these amazing insights.
BEFORE YOU GO
I have a very important favor to ask, which as those of you who know me know I don’t do often. If you get any pleasure or inspiration from this episode, could you PLEASE leave a review on your favorite podcasting platform – be it iTunes, Overcast, Spotify, or wherever you get your podcast fix. This podcast is very much a labor of love – and each episode takes many many hours to put together. When you write a review, it will not only be a great deal of encouragement to us, but it will also support getting the word out about the Mobile User Acquisition Show.
Constructive criticism and suggestions for improvement are welcome, whether on podcasting platforms – or by email to shamanth@rocketshiphq.com. We read all the reviews & I want to make this podcast better.
Thank you – and I look forward to seeing you with the next episode!