
In this episode, we dive into a common pitfall we’ve seen many developers fall into lately. While many ad networks use probabilistic models for optimization, they turn to SKAN data when it comes to billing. This discrepancy might mean you’re paying 30-40% more than anticipated or that your campaign’s performance isn’t as stellar as you believed. In this episode, I unpack the underlying mechanics of what is happening – and what we recommend doing instead.
***


ABOUT ROCKETSHIP HQ: Website | LinkedIn | Twitter | YouTube
FULL TRANSCRIPT BELOW
Today I want to talk about a common pitfall to watch out for while working with ad networks that use probabilistic modeling for their attribution and reporting.
Many of these ad networks use probabilistic models for optimization BUT they use SKAN data for billing.
The impact of this? If all you are looking at is your spend according to probabilistic models and your CPA or ROAS according to probabilistic models, and you’re using this to measure your performance and inform your future budgets, you MIGHT just find that your end of month bill from ad networks is 20-30% higher than the spend that you accounted for in your daily and weekly reports.
And if you have a finance team that sits siloed from your UA or media buying team, this could be a huge gap that can cost you tens of thousands, if not hundreds of thousands.
Here is what the actual math does look like on 2 different networks for a product that we’re working on:
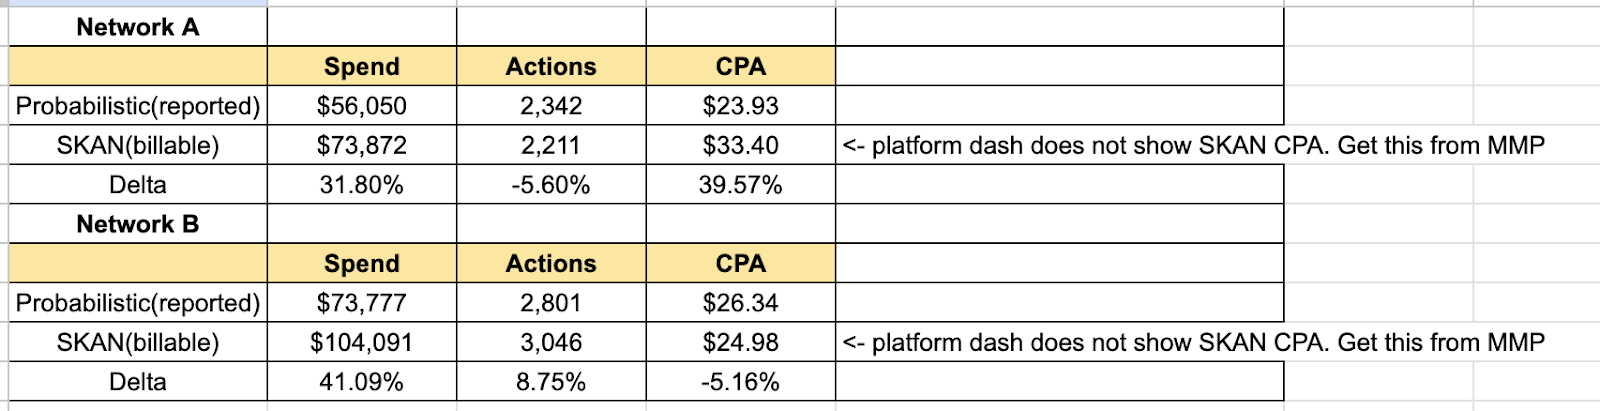
So you see the billable spend is anywhere from 30-40% more than what you are reporting – which is crazy.
To be fair, the platforms do have documentation around how they bill and how they report – but this is easy to miss – especially if you are relatively inexperienced or are on a self-serve version of these platforms.
When I asked a person from one of the networks, this was what they had to say(I have edited this lightly to remove identifying details of specific parties’ identities):
- What’s misleading on the MMP dash is -> you’re comparing the data using SKAN installs/cost and probabilistic event count, your CPA will seem higher than it actually is. This is because if SKAN sees 100 installs, but probabilistic only sees 80, 20 of your installs will seem like they generated 0 revenue.
- Apple, as the owner for both iOS hardware and software, made SKAN the most accurate source of install attribution. this is why we use it for billing + attribution purposes.
- However, there are significant limitations with SKAN, the two most significant being:
- 1) it does not pass install postbacks in real-time, rather on a minimum 24-48 hour delay
- 2 ) we don’t receive post-install data per install (so our platform would be unable to build a model, therefore we couldn’t run any user-level optimised campaign.)
- For that reason, we use probabilistic attribution for day-to-day budget management + modeling purposes.
- SKAN installs are used for attribution + billing, and probabilistic data from MMP to measure daily budgets/for optimisation purposes.
So: this is the problem – and if you are not looking out, you might be misreporting your ROAS or CPA by as much as 30-40%.
What should you do about it? There are 2 approaches:
| Spend | Conversions | CPA | ||
| Aggressive | $73,872 | 2,914 | $25.35 | <- take billable spend, but add ~31% to your Conversions, based on the assumption that probabilistic is actually missing out on 30% of conversions. |
| Conservative | $73,872 | 2,211 | $33.40 | <- use billable spend and SKAN conversions as the source of truth(not probabilistic) |
If you want to take an aggressive approach, you take billable spend, but add a multiplier(say an additional ~31%) to your conversions, based on the assumption that probabilistic is actually missing out on 30% of conversions.
Based on this, your ‘true’ conversions are about 30% more than what probabilistic is reporting – and your billable spend is, well, your true spend.
If you want to take a conservative approach, use SKAN conversions as the source of truth(not probabilistic) – and billable spend as actuals.
This is based on the assumption that only billable spend and SKAN are objective and reliable. And if you are comparing 2 different channels, you have to compare them based on SKAN – because probabilistic models across different channels may or may not be similar.
And of course, using the conservative approach allows you to compare a probabilistic channel’s performance versus a SKAN channel’s performance(say Meta or TikTok) – after you account for null conversion values of course.
What do I recommend? I recommend the conservative approach – because even if it doesn’t capture all conversions, it relies on credible sources of truth – and it allows easier comparison across channels.
And of course I do recommend looking out for and verifying your billable spend – and being very very careful of ‘reported spends.’
A REQUEST BEFORE YOU GO
I have a very important favor to ask, which as those of you who know me know I don’t do often. If you get any pleasure or inspiration from this episode, could you PLEASE leave a review on your favorite podcasting platform – be it iTunes, Overcast, Spotify, or wherever you get your podcast fix? This podcast is very much a labor of love – and each episode takes many many hours to put together. When you write a review, it will not only be a great deal of encouragement to us, but it will also support getting the word out about the Mobile User Acquisition Show.
Constructive criticism and suggestions for improvement are welcome, whether on podcasting platforms – or by email to shamanth@rocketshiphq.com. We read all the reviews & I want to make this podcast better.
Thank you – and I look forward to seeing you with the next episode!